detecting cancer cells with odor receptors
Strauch et al., Scientific Reports, 2014
Chemosensing with artificial devices (“electronic noses”) involves the detection and identification of chemicals, e.g. metabolic markers of disease. Whenever artificial systems reach their limits, animal chemosensing becomes an option.
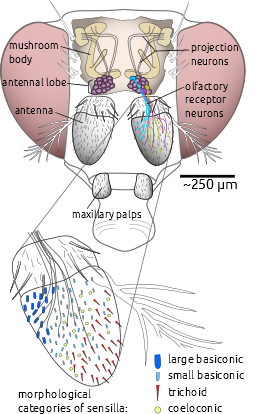
We used the odor receptors on the antenna of the fruit fly Drosophila melanogaster to tell apart cancer cells from healthy cells by their smell (summarised by iflscience!, helmholtz.de, Smithsonian Magazine). This is a direct readout from biological sensors, as opposed to the common indirect readouts by observing animal behaviour.
real-time visualisation of brain activity
Strauch et al., BioVis 2012, Seattle; extended journal version: Strauch et al., BMC Bioinformatics, 2013
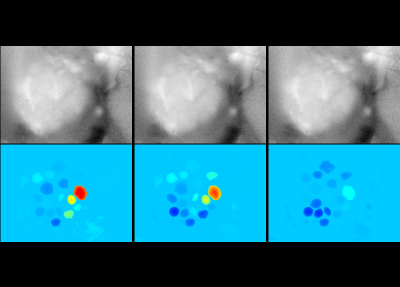
Activity patterns in the insect antennal lobe are characteristic for the odor that has been smelled. We developed an incremental signal processing algorithm (along with a fast implementation using the GPU) to extract these patterns from a stream of recorded brain activity. Real-time signal processing provides direct access to the “shape of an odour” as it is represented in spatial activity patterns in the brain.
Video clips of brain activity in the honeybee antennal lobe: video_1 (before the experiment), video_2 (visualisation during the experiment).
smelling better with bigger noses at higher odor concentrations
Strauch et al., Front. Syst. Neurosci., 2012
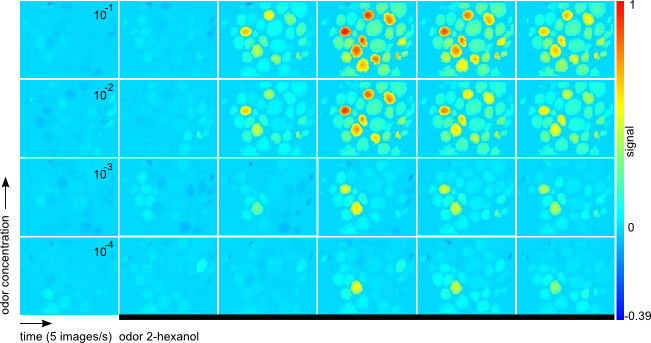
When honeybees smell an odor, a characteristic, odor-specific activity pattern can be observed in the antennal lobe, a dedicated olfactory center of the honeybee brain. Thus, from the pattern we (and the bee) can derive the identity of the odor.
Confusingly, different concentration levels of the same odor also lead to different activity patterns. We found that this may not be a bug, but rather a feature: At high odor concentrations, the distances between activity patterns better reflect the distances between the corresponding odors (chemical molecules), thus providing a more faithful picture of the odor world.
algorithms for gene expression time series data
Supper, Strauch et al., BMC Bioinformatics, 2007
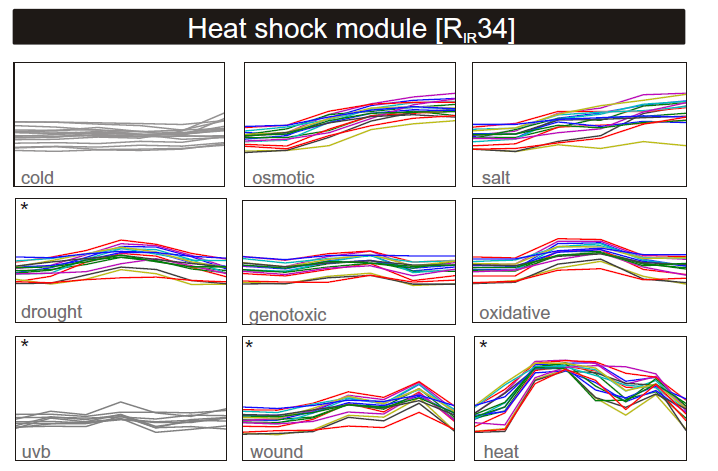
As a first step in understanding gene regulation, clustering and biclustering approaches help to find genes with similar changes in gene expression over time. We looked at the gene expression changes in Arabidopsis thaliana under abiotic stress conditions (such as heat or UVB), considering that genes may be correlated only in a subset of the conditions.
See also my Masters thesis (“Diplomarbeit”).
.